





To inspect element on an Android device, connect the phone to a computer by USB, enable USB debugging in Developer options, then open chrome://inspect#devices in desktop Chrome and click inspect next to the tab you want. This opens the full Chrome DevTools for the page running on the phone, including live HTML and CSS editing.
Three other routes work when USB isn't an option:
- Wireless debugging over ADB, on Android 11 and later, no cable needed.
- An on-device console injected with Eruda or vConsole, when you have no computer at all.
- Firefox remote debugging via about:debugging in desktop Firefox, for pages in Firefox for Android.
All four are covered below, followed by a troubleshooting section for the most common failure: your device not appearing in chrome://inspect.
Inspect Element lets you read and change a page's HTML, CSS and JavaScript while it runs, which makes it the quickest way to understand how a webpage is actually built. It's usually associated with desktop browsers, but everything it does is available on Android, whether you're debugging a layout that only breaks on a phone, restyling a page temporarily to test an idea, or learning web development by taking sites apart.
Mobile is where a lot of these problems live. A page that behaves perfectly in a resized desktop window can still break on a real handset, because a phone brings its own browser engine version, touch behaviour, system fonts, and network conditions. Inspecting on the device itself is the only way to see what's genuinely happening rather than an approximation of it.
What is Inspect Element?
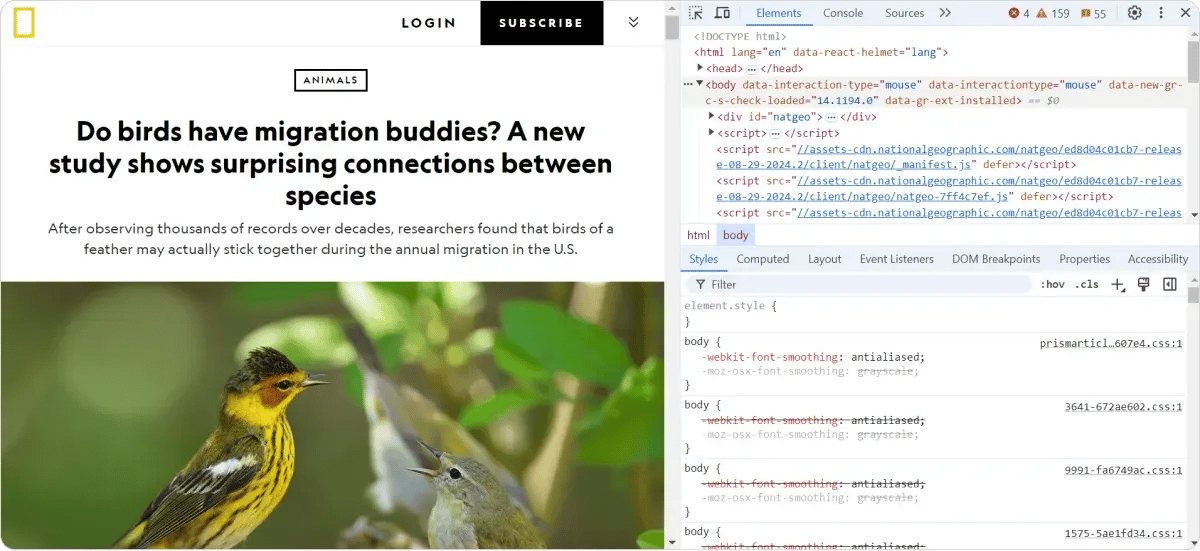
Inspect Element is a browser feature that shows a page's live HTML, CSS and JavaScript and lets you edit them in real time. Changes take effect instantly in your browser and disappear on reload, nothing is sent to the server and no other visitor sees them.
It gives you access to three layers of the page:
- HTML — the structure, as the browser currently holds it
- CSS — every rule applied to an element, including which ones are overridden and by what
- JavaScript — the console, network requests, and the ability to pause execution mid-run
Inspect Element vs View Source: what's the difference?
These are frequently confused and they show different things. View source returns the HTML the server originally sent. Inspect Element shows the DOM, the page as it exists right now, after JavaScript has added, removed and rearranged things.
On a modern site built with a framework, the two barely resemble each other: view source may return a near-empty shell while the inspector shows a complete page. This distinction matters when you pick a method below, because several tools that advertise element inspection on Android only ever show you the served source.
Why inspect element on an Android device instead of a desktop browser?
Desktop DevTools includes a device toolbar that resizes the viewport and spoofs a mobile user agent. That's useful for layout work, but it runs your desktop browser engine with desktop fonts and a mouse. A real handset differs in ways emulation cannot reproduce, which is why some bugs only ever appear on the device.
- Faults that only exist on real hardware. Sticky headers that jump when the mobile address bar collapses, 100vh sections that overflow because the toolbar counts toward viewport height, tap targets that work with a cursor but not a thumb, and momentum scrolling behaviour. None of these reproduce in a resized desktop window.
- Genuine responsive verification. Emulation approximates screen dimensions. It doesn't give you the device's actual pixel density, system font rendering, or the browser version that ships on that handset.
- Browser engine differences. Android users aren't all on Chrome — Samsung Internet holds meaningful share on Samsung hardware, and Firefox uses a different engine entirely. Inspecting in the browser your users actually run is the only way to catch engine-specific rendering.
- Mobile-first indexing checks. Google indexes the mobile rendering of your pages. Inspecting on a device shows whether your headings, structured data, canonical tags and lazy-loaded content are present in the DOM the crawler would see — not just in the version your desktop browser builds.
- Safe experimentation. Because edits are temporary and local, you can restyle a live page, change copy, or reorder elements to test an idea before anyone writes code.
- Learning by disassembly. Taking apart a page that works well on mobile is a fast way to understand how responsive layouts, touch interactions and performance optimisations are built.
Real device or emulator: which should you use?
| Question you're answering | Use |
|---|---|
| Does this layout hold at a narrow width? | Desktop device toolbar — faster to iterate |
| Why does this break only on phones? | Real device, inspected remotely |
| Does it work across the handsets my users own? | Real devices at scale — emulation can't answer this |
How do you inspect element on an Android device using Chrome DevTools?
This is the primary method and the only one that gives you the complete DevTools feature set. It requires a computer and, for the USB route, a data-capable cable. Under the hood it uses the Android Debug Bridge (ADB), but Chrome handles that for you — you don't need to install ADB or run any commands.
Step 1: Enable Developer options on the phone
- Open Settings → About phone.
- Tap Build number seven times. You'll see "You are now a developer."
- Go to Settings → System → Developer options.
- Turn on USB debugging.
Menu paths vary by manufacturer. On Samsung devices, Build number sits under Settings → About phone → Software information. [VERIFY on a current handset — these paths move between Android releases and OEM skins.]
Step 2: Connect and authorise
- Connect the phone to the computer with a USB cable.
- On the phone, set the USB mode to File transfer (or MTP). Charging-only mode will not expose the debug bridge.
- A prompt appears on the phone asking you to allow USB debugging, showing an RSA key fingerprint. Tap Allow. If you miss this prompt, the device will never appear on the desktop — and this is the single most common reason this method appears not to work.
Step 3: Open the inspector
- On the phone, open Chrome and load the page you want to inspect.
- On the desktop, open Chrome and go to chrome://inspect#devices.
- Confirm Discover USB devices is ticked.
- Your device appears with a list of its open tabs. Click inspect beneath the tab you want.
A DevTools window opens, mirroring the phone screen. Everything works as it does on desktop: the Elements panel for the live DOM, editable CSS, the Console, Network, Performance, and JavaScript breakpoints. Changes appear on the phone instantly and are discarded on reload.
Chrome also lists WebView contexts from installed apps, but only where the app was built with setWebContentsDebuggingEnabled(true). Release builds of third-party apps generally won't appear.
How do you inspect element on Android wirelessly, without a USB cable?
Android 11 introduced wireless debugging, which pairs the phone to your computer over the local network. Both devices must be on the same network. This method does require the ADB command-line tool, available in the Android SDK Platform Tools.
- On the phone, go to Developer options → Wireless debugging and turn it on.
- Tap Pair device with pairing code. The phone shows a six-digit code plus an IP address and port.
- On the computer, run adb pair IP:PORT using the pairing port shown, and enter the code when prompted.
- Then run adb connect IP:PORT using the connection port from the main Wireless debugging screen — it differs from the pairing port, which trips most people up.
- Open chrome://inspect#devices on the desktop. The device now appears exactly as it would over USB.
The pairing survives until you disable wireless debugging or the phone leaves the network. Ports change on reconnection, so expect to repeat step 4 rather than step 2.
How do you inspect element on Android without a computer?
Chrome for Android has no built-in developer tools, and neither does Firefox for Android. To inspect a page using only the phone, you inject a console into the page itself. Eruda and vConsole are the two established libraries for this.
You load one via a bookmarklet:
- In Chrome for Android, create a new bookmark. Any page will do — you're going to overwrite the URL.
- Edit the bookmark, name it something short like eruda, and replace the URL with:
javascript:(function()%7Bvar%20s%3Ddocument.createElement('script')%3Bs.src%3D'https%3A%2F%2Fcdn.jsdelivr.net%2Fnpm%2Feruda'%3Bdocument.body.append(s)%3Bs.onload%3Dfunction()%7Beruda.init()%7D%7D)()%3B - Open the page you want to inspect, type eruda in the address bar, and tap the bookmark suggestion. Chrome blocks javascript: URLs pasted directly into the address bar, so it must be triggered from a saved bookmark.
- A floating button appears. Tap it for a console with Elements, Console, Network and Resources panels.
What this gives you and what it doesn't. You get a genuine view of the live DOM with editable styles, on the device, with no computer involved. You don't get breakpoint debugging, performance profiling, or anything requiring the browser's own internals. For checking why a layout breaks on a specific handset, it's enough.
Two things worth knowing: sites with a strict Content-Security-Policy will block the injected script, and this only works on pages you load in a browser, not inside native apps.
What about apps that claim to inspect element?
Play Store apps such as VT View Source fetch a URL and display its returned source. That is view source, not inspect element — you see the HTML the server sent, not the live DOM after JavaScript has run. For a modern single-page application the two barely resemble each other. They're fine for a quick look at markup or metadata, and useless for debugging rendered behaviour.
Kiwi Browser, which used to be the standard recommendation here because it exposed Chromium DevTools on-device, was discontinued and its repository archived. [VERIFY current status before referencing it either way.]
How do you inspect element in Firefox on Android?
Firefox for Android has no on-device inspector. It supports remote debugging from desktop Firefox instead:
- On the phone, enable USB debugging in Developer options as described above.
- In Firefox for Android, open Settings → Remote debugging via USB and turn it on.
- Connect the phone by USB.
- On the desktop, open Firefox and go to about:debugging.
- Select Setup, then connect to your device in the sidebar and choose Inspect next to the target tab.
You get the Firefox DevTools — Inspector, Console, Debugger, Network — against the page on the phone. Useful specifically when you're chasing a Gecko-only rendering difference; otherwise Chrome's route is less fiddly.
Why is my device not showing up in chrome://inspect?
Work through these in order. The first three account for the large majority of cases.
- The RSA authorisation prompt wasn't accepted. Unplug, replug, and watch the phone screen. If no prompt appears, go to Developer options → Revoke USB debugging authorisations, then reconnect to force it.
- USB mode is set to charging only. Pull down the notification shade, tap the USB notification, and switch to File transfer.
- The cable is charge-only. Many bundled and cheap cables carry no data lines. Swap it before changing anything else.
- Your manufacturer requires an extra toggle. Xiaomi's MIUI and HyperOS need USB debugging (Security settings) enabled in addition to standard USB debugging, and that option requires a signed-in Mi account. Other manufacturers have their own equivalents — see the table below.
- Discover USB devices is unticked on the chrome://inspect page.
- No page is open in Chrome on the phone. The device row appears but lists no inspectable targets.
- Another ADB instance holds the connection. Android Studio, Scrcpy or a stale server will claim it. Run adb kill-server, then reconnect.
- The device shows as unauthorized or offline in adb devices. Unauthorised means step 1. Offline usually means a bad cable or an interrupted connection.
- Desktop Chrome is older than Chrome on the phone. DevTools speaks a versioned protocol; update the desktop browser.
Which Android manufacturers need extra steps for remote debugging?
Standard guides assume stock Android. Most of the world isn't running stock Android, and several manufacturer skins add requirements that aren't documented anywhere obvious. [VERIFY every row on a current handset before publishing.]
| Manufacturer / skin | Extra step required | Notes |
|---|---|---|
| Xiaomi — MIUI / HyperOS | Enable USB debugging (Security settings) in addition to standard USB debugging | The toggle stays greyed out until you sign in to a Mi account; many builds also require an inserted SIM card |
| Oppo / Realme — ColorOS | Unlock Developer options via Settings → About device → Version, then enable USB debugging and Install via USB | Build number sits under Version, not directly under About device |
| Vivo — Funtouch OS / OriginOS | Unlock via Settings → About phone → Software version, then enable USB debugging | Some builds add a second USB debugging (Security settings) toggle requiring a signed-in vivo account |
| Huawei / Honor — EMUI / MagicOS | Developer options sit under Settings → System & updates → Developer options; enable USB debugging and ADB debugging in charging mode | Devices shipping HarmonyOS NEXT may not expose standard ADB at all |
| Samsung — One UI | Turn off Auto Blocker, or its Block USB commands option, under Settings → Security and privacy → Auto Blocker | Auto Blocker is enabled by default on recent One UI versions and blocks ADB with no error message. Build number is under About phone → Software information |
Related: Android device testing and mobile testing challenges.
Which method should you use?
| Situation | Use |
|---|---|
| Full debugging, computer available | Chrome DevTools over USB |
| Computer available, no usable cable | Wireless debugging (Android 11+) |
| Phone only, no computer | Eruda or vConsole bookmarklet |
| Gecko-specific rendering issue | Firefox about:debugging |
| Just need to read the served HTML | View-source app or view-source: URL |
Frequently asked questions
Can you inspect element on Android without a computer?
Yes, by injecting a console library such as Eruda or vConsole into the page with a bookmarklet. You get a live DOM view and editable styles on the device. You don't get breakpoint debugging or performance profiling, which require desktop DevTools.
Does Chrome for Android have built-in developer tools?
No. Chrome for Android ships no on-device DevTools. Inspecting a page in it requires either remote debugging from a desktop or an injected console.
Can you inspect element on an iPhone the same way?
The concept is the same but the tooling differs. On iOS you enable Web Inspector in Safari's advanced settings on the phone, then connect to a Mac and use Safari's Develop menu. Chrome's chrome://inspect does not work with iOS devices.
Are changes made with Inspect Element permanent?
No. Edits live only in the browser's current session and vanish on reload. Nothing reaches the server or affects other visitors.
Why does my app's WebView not appear in chrome://inspect?
WebView contexts are only inspectable when the app enabled it at build time via setWebContentsDebuggingEnabled(true). Release builds normally leave it off.
Do you need root access to inspect element on Android?
No. All four methods work on unmodified retail devices.
How can Global App Testing help with Android testing?
Remote debugging tells you what's happening on the handset in your hand. It doesn't tell you which of the thousands of Android device-and-OS combinations in your market break your page, and as the OEM table above shows, the manufacturers most likely to cause problems are often the ones missing from a local device lab.
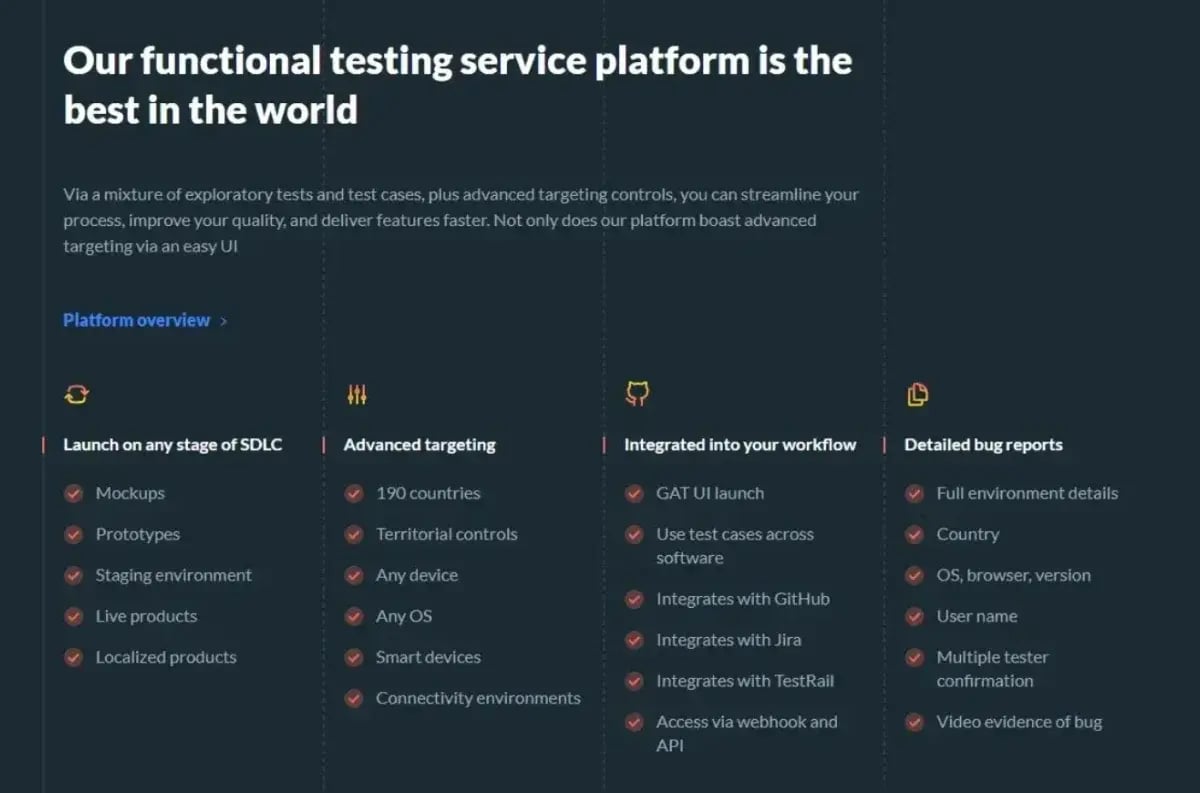
Global App Testing is a crowdtesting platform that runs Android testing on real devices through a tester network spanning more than 190 countries and territories, on real consumer handsets and real mobile networks rather than emulators in a data centre.
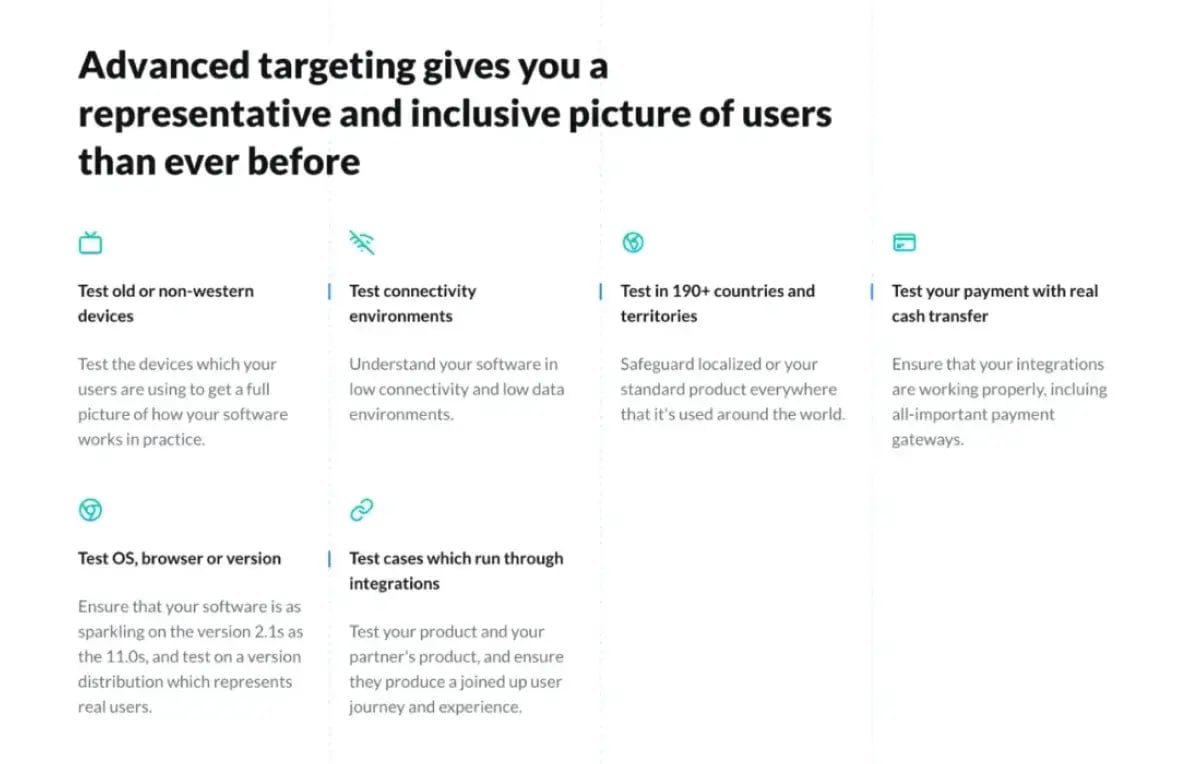
- Device and network coverage that matches your market. Testing runs on the handsets your users actually own, across models and the OS versions and carrier networks in use locally — including the manufacturer skins listed above.
- Results in hours, not sprints. so fixes land inside the same cycle and release cadence doesn't slip.
- Test scope you set. From a handful of testers on one device family to broad coverage across regions and manufacturers, scaled to the release rather than a fixed package.
- Bug reports you can act on directly. Each issue arrives with device model, OS version, reproduction steps and supporting evidence, so an engineer can reproduce it without a follow-up conversation.
- Integrations with the tools you already use. Issues flow into your existing workflow through platform integrations.
- Security and compliance. Global App Testing is certified to ISO 27001:2023. The platform is hosted on Amazon Web Services, which holds AICPA SOC 2, ISO 27001 and ISO 27017 certification.
Talk to us about Android device coverage.
Keep learning
Android Device Testing — Everything You Need To Know
Android mobile app testing checklist
10 QA mobile testing types you need to know about
Types of web application testing