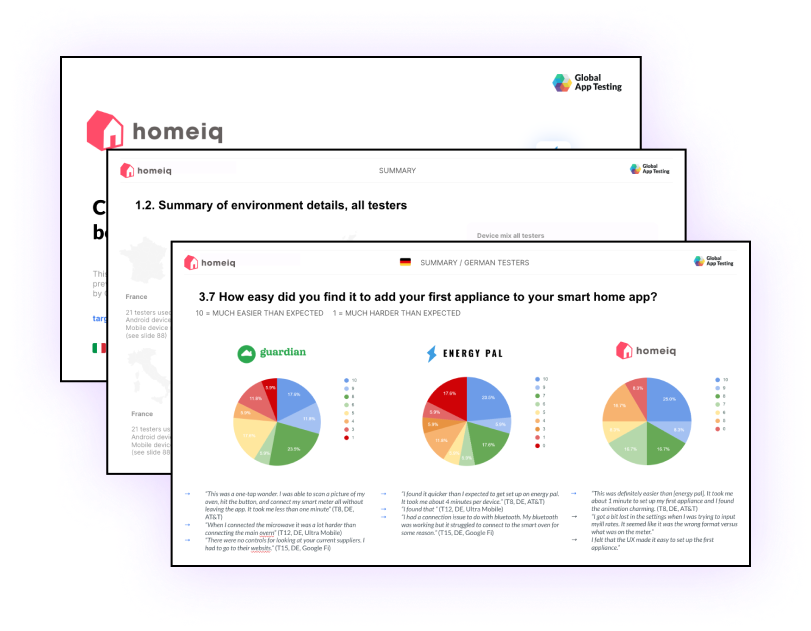
Get a breakdown of how you and your competitors work in a targeted environment

Run a pulse check competitor survey to get a complete theory of product performance. We’ll check a live product or prototype for any kind of issue – including functional, translation or localization errors, UX issues, local performance in real devices; and then survey from appropriate demographics. Check out a few example slides we adapted from a real report we put together. 

What should I include in the report?

chat-bubble-oval-left-ellipsis
Compare qualitative UX analysis
  • Sentiment of testers
  • Design suggestions by testers
  • Usability suggestions by testers
  • Time-to-complete tasks
  • Direct survey questions
  • Step=by-step descriptions of their experiences


chat-bubble-oval-left-ellipsis
Compare core flows and features
  • Like-for-like feature comparison
  • Like-for-like test case completion
  • Commentary on product design or quality
  • Map core flows vs competitors 
  • Understand local experience vs competitor


cloud-arrow-down
Compare spot performance
  • Test your local product speed
  • Test low data environments performance
  • Test rural environments performance
  • Test average device performance
  • Test performance from locations
question-mark-circle
Compare something specific

You can ask the crowd direct questions as well as asking them to undertake timed assessments, run audits looking for something specific, or ask for something more bespoke!

Process your results and share them with your team more easily

Global App Testing clients get competitor reports to understand their clients better and to put their test results in the context they work. 

  • Understand your results in context
  • Communicate with broader team
  • Start an internal conversation 
  • Identify problem areas vs competitors
  • Understand why your local market performance looks like it does
homeiq in scatter graph

Report FAQs

How fast will GAT turnaround a report?

Quickly! Part of the reason businesses choose GAT is that our scaled insights are faster than most competitors. If your report is based on a 15 question survey, we'd expect the report to be completed within 2-4 working days. 

If you have higher-tier test condition requirements, or the report goes beyond 20 questions, that can add time to the report build on the set-up or the analysis end. 

What is a typical report length?

Our reports are built custom to the needs of the client and it's hard to identify an "average" report. But a typical report might include the following:

  • 2-4 competitors
  • 2-3 markets 
  • 6 or 7 testers per market
  • One control OS across varied devices 
  • 15 questions

This would produce a report similar to the sample embedded above but about 50-60 pages long.

What are my targeting options?

Global App Testing can help you test your product in 190+ countries and territories, and in any device environment based on our crowd of over 90,000 testers.

How much can a report cost?

Generally we encourage clients to take on a long-term contracts for continued value with Global App Testing; the testing (rather than the formatting and the analysis) is where the fee generally goes and factors like how much it costs to test a product in different geographies and devices affects the final fee.

If you'd like to look into a competitor report as a project to help validate a longer-term engagement with Global App Testing, ask our sales team via the button above and we can suggest a test scope to fit your budget.

Let's talk about competitor benchmarking reports

  • Understand how our solutions can help you
  • Advise on industry best practice
  • Get an estimate for how much GAT costs
  • Give you a platform demo
  • Talk through examples of how we’ve worked with similar companies to yours
Trusted by:
google-logo
Facebook_Logo_(2019).svg
Atlassian-logo
microsoft