
Did you know that, on average, people glance at their phones around 58 times daily, while Americans hold a staggering average of 144 times a day? But why do we even use phones? Is it for something truly useful or just out of habit?
We spend 88% of our time on apps, whether checking social media, writing emails, playing games, shopping, or taking cute pictures. So, read along to discover 30+ mobile app development statistics that can help you develop an app that people will use and enjoy and secure a slice of this multi-billion dollar cake!
Global mobile app market overview
The mobile app industry is on a robust growth trajectory, driven by the increasing production of feature-rich smartphones and a growing user base.
1. According to Statista, the global mobile app market is projected to reach $756 billion by 2027, with a steady Compound Annual Growth Rate (CAGR) of 8.58% from 2022 to 2027.
This expansion has intensified consumer demand for innovative and feature-packed apps, leading to a broader business scope for developing user-centric applications. Notably, startups, small businesses, SMEs, and enterprises are investing significantly in mobile app development to meet the rising demand for customer-oriented apps.
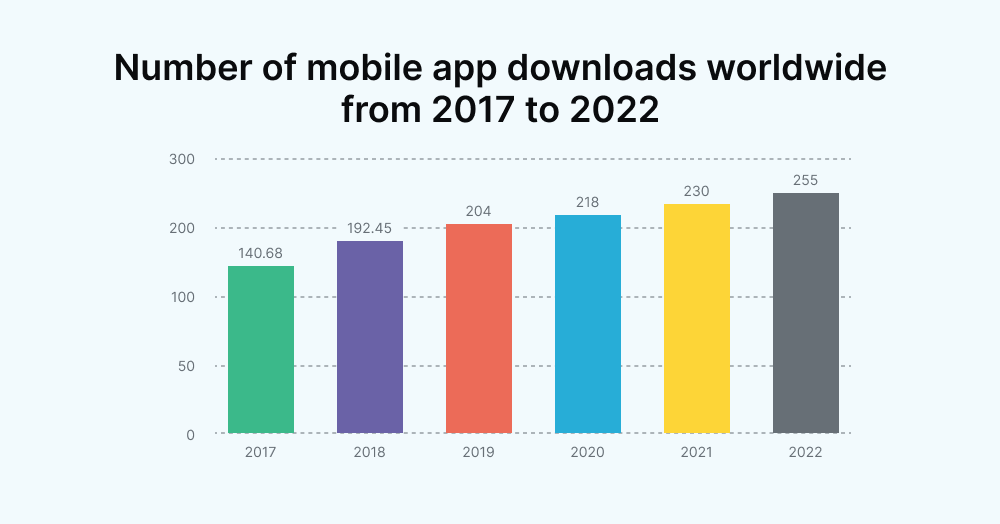
2. From 2016 to 2022, the annual app downloads witnessed a substantial 82% increase.
3. The Apple App Store and Google Play Store have approximately 35-36 billion app downloads every quarter.
4. The surge in mobile traffic is evident, with roughly 60% of website visits originating from mobile devices. A significant 92.3% of internet users connect to the web via mobile phones, predominantly smartphones. This trend underscores the escalating significance of mobile apps in response to the widespread use of mobile devices.
Mobile app users’ behavior statistics
Have you ever questioned the rationale behind building an app? The answer is straightforward. Apps have become integral to our lives, from learning a new language to ordering Uber or tracking physical activity. Smartphones' prevalence and convenience have propelled mobile apps into the spotlight. Let's see who you are developing your mobile app for.
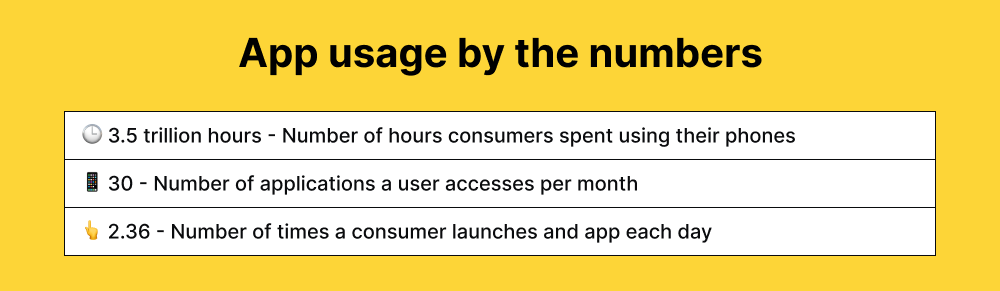
5. The typical smartphone user dedicates approximately 3 hours and 10 minutes daily to their device, with a substantial portion – around 2 hours and 51 minutes – spent engaging with apps, constituting nearly 90% of smartphone usage.
6. Despite over 80 apps installed on an average smartphone, the reality is that not all these apps witness active use. On average, individuals use 9 mobile apps daily and 30 apps monthly. However, despite the average number of apps installed, nearly 62% remain unused each month. In fact, a striking 25% of apps experience only a single use after download and are subsequently never used again.
7. Keeping users engaged can be challenging for businesses relying on mobile apps to boost customer loyalty and sales. On average, about 28% of users uninstall an app within the first 30 days, meaning almost one-third of those who initially installed your app have second thoughts. The reasons for uninstalling vary, from needing more space on their device to unmet expectations from the app provider. But don't celebrate those who stick around past the 30-day mark just yet; the churn rate climbs to 71% within 90 days. Then, there are inactive users who neither bother to uninstall nor use the app. Approximately one-fifth of users interact with an app only once after installation.
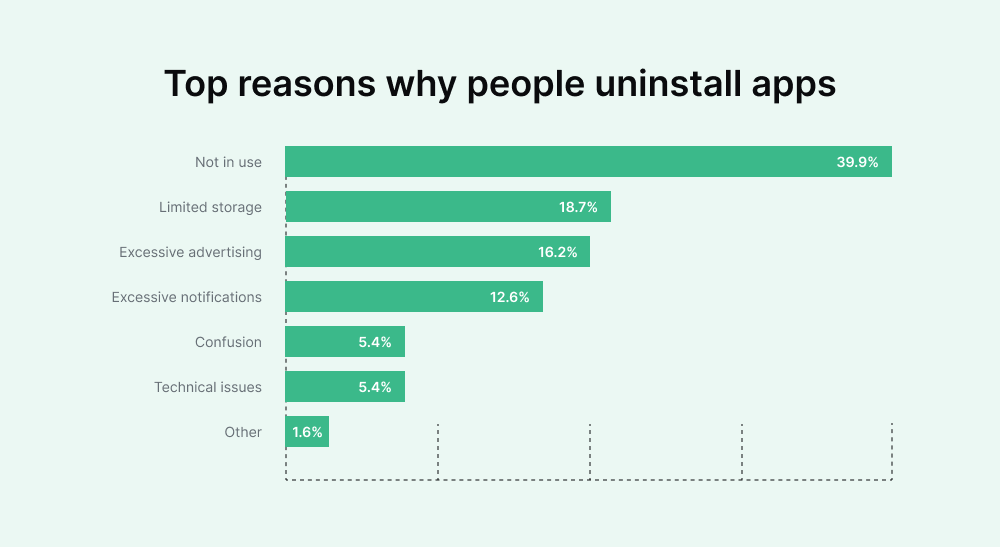
8. According to a survey, the main reason someone is uninstalling the app is they simply don't use it. Other reasons for uninstalling vary, from needing more space on their device to unmet expectations from the app provider.
Users are more likely to churn when your app underperforms, is buggy, or has user experience (UX) flaws. Perfection is rare in the app world, even for top apps that may encounter occasional bugs. However, you must pinpoint these issues, initiate updates, and introduce new versions to enhance performance and improve the overall user experience.
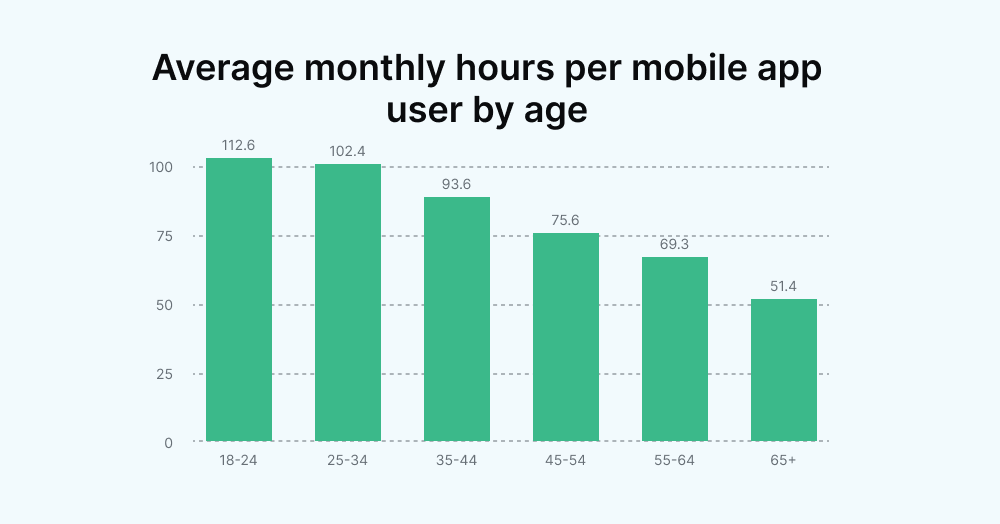
9. Individuals aged 45-54 allocate approximately 1 hour and 15 minutes daily to using mobile apps. This duration is only 27 minutes less than individuals in the 25-34 age bracket. Surprisingly, even mobile users over 65 dedicate nearly an hour to mobile apps daily.
10. Despite the rising use of smartphones in our daily lives, only approximately 1 in 10 people (10.3%) perceive screen time as positively impacting mental health. In contrast, 68.6% of survey participants believe that screen time hurts mental well-being.
In the same study, respondents were asked about what they associated with screen time. The response with the highest agreement (54.7%) was the eye strain.
Mobile apps download statistics
Apps need downloads to thrive. It may sound simple, but many app owners overlook this crucial aspect. Even if you have the best app, you won't earn anything if people aren't downloading it. Before you can get users to download your app, take the time to do some research. Understanding your audience and what they want is key to making your app successful.
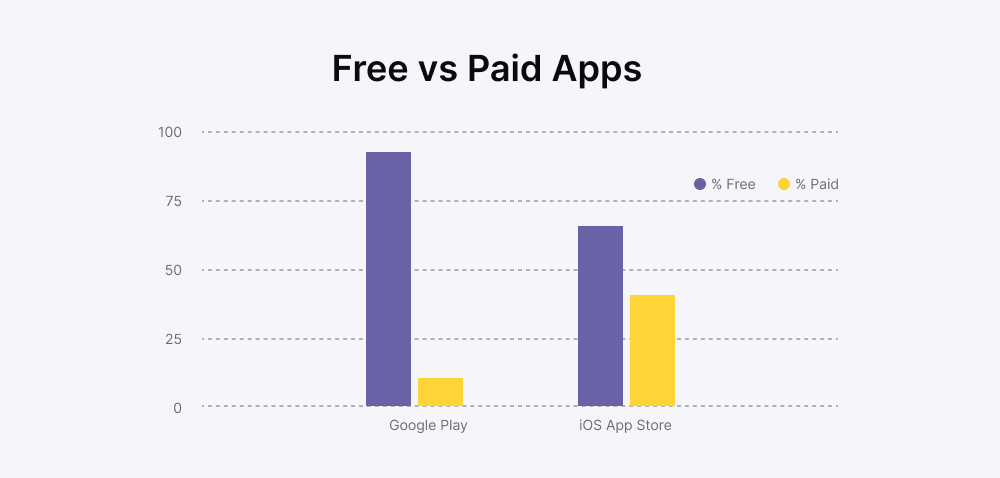
11. Most global downloads are free, with 97% of mobile app revenue worldwide coming from free apps. While launching a paid app has merits, it may result in fewer downloads initially, as most users are accustomed to free options. Paid app users, however, tend to be more engaged.
Yet, there are other ways to monetize your app than charging for downloads, like advertising, in-app purchasing, etc.
Google Play vs. App Store download statistics
Most mobile users download apps from two leading platforms: iOS users get their apps from the Apple App Store. In contrast, Android users opt for downloads from the Google Play Store. Let's compare the global app download trends between these two app stores.
12. Google Play Store is the go-to platform for a global audience, hosting over 2.65 million Android apps and 494,000+ publishers as of the first quarter of 2022. Despite quality control measures, the store sees a daily addition of approximately 3,739 new mobile apps. This consistent growth has made Google Play Store the largest mobile app store globally, with a recent download rate reaching around 111.3 billion, marking a 50% increase from 2016.
13. The Apple App Store, the second-largest competitor to the Google App Store, boasts a diverse user base globally. Presently, it offers 2.11 million iOS mobile apps from 724,000+ publishers, with around 221,666 dedicated to Games and the rest categorized as non-gaming apps. In June 2022 alone, the App Store introduced 36,000 iOS mobile apps.
Anticipating sustained growth, the App Store is projected to achieve revenue of approximately $96 billion by 2023, compared to $88 billion in the first quarter of 2022, reflecting its increasing popularity and expanding user base worldwide.
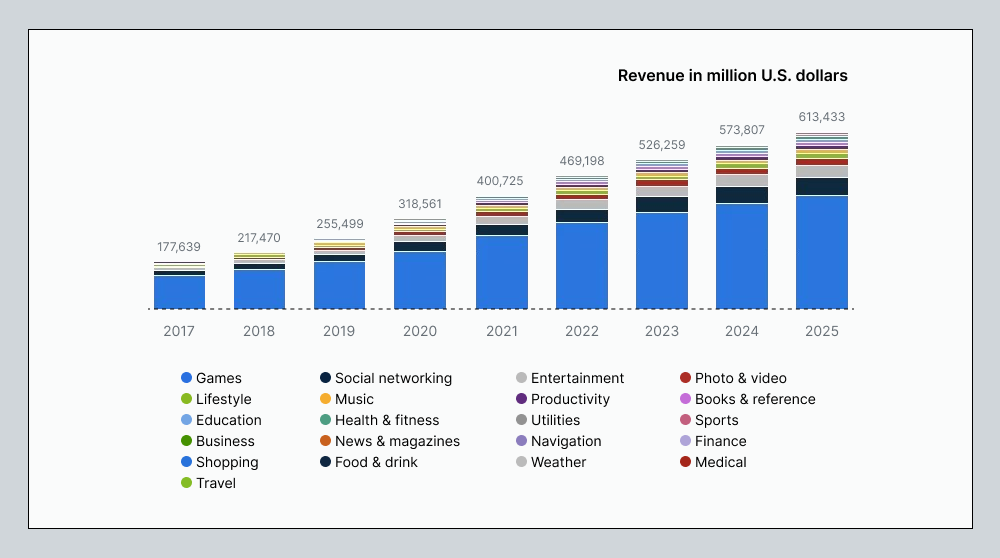
Mobile app categories and trends
Here are the market statistics for popular categories on both the Play Store and App Store:
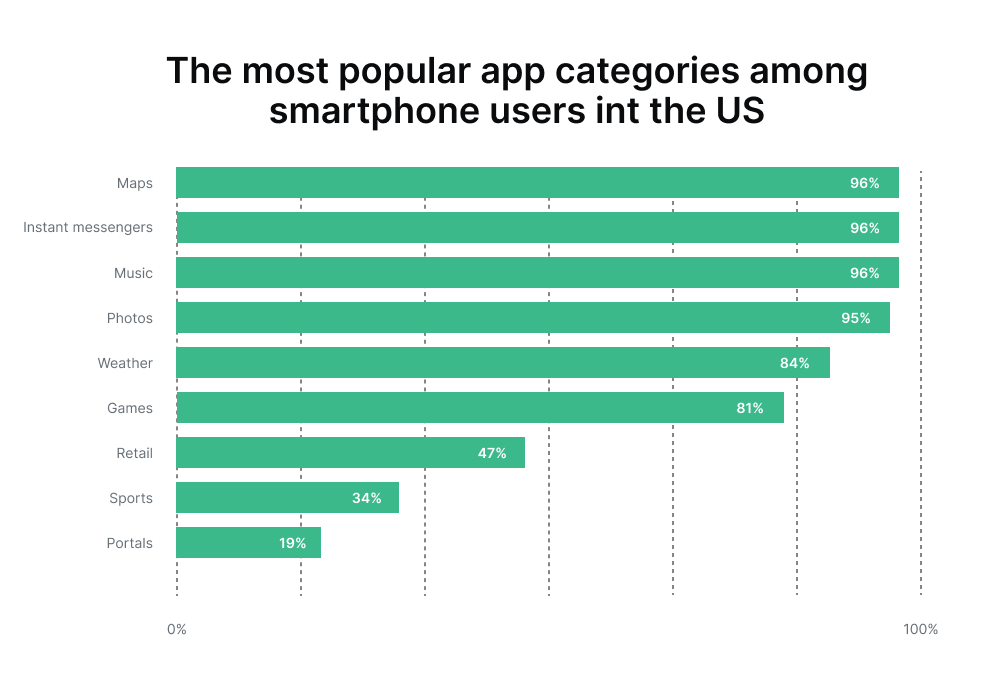
14. Half of app users primarily use apps for communication purposes. Specifically, 40% of smartphone users identified social media apps as their most frequently used category. In comparison, 10% expressed the same preference for messaging apps.
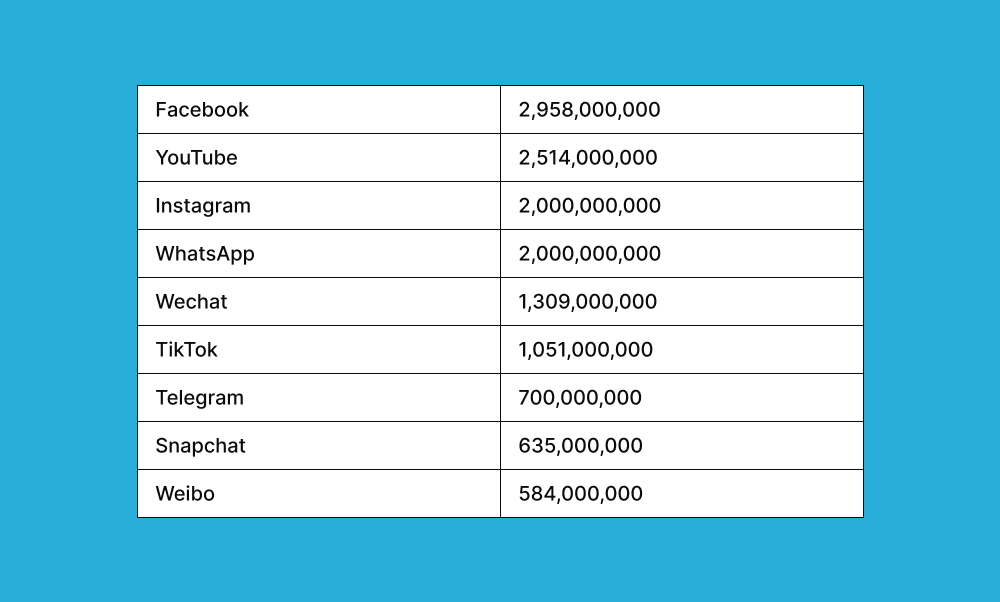
15. Facebook emerges as the unparalleled leader in the app landscape, boasting over 4 billion downloads by 2020. Its counterpart, Facebook Messenger, secures the second spot with an impressive 3 billion downloads. As of 2022, TikTok has been downloaded 2 billion times globally, making it a top-rated app.
In the United States, TikTok claims the throne as the most downloaded app in 2022, amassing a staggering 99 million downloads. Noteworthy contenders in the top five include Instagram (72 million), Cash App (64 million), WhatsApp (63 million), and Snapchat (54 million).
Amazon is the most crucial app for 35% of individuals aged 18-34. Millennials and Gen Z also highlight other indispensable apps, such as Gmail (30%), Facebook (29%), Facebook Messenger (18%), and YouTube (16%).
16. In gaming, revenue streams often revolve around micro-transactions for enhancements and cosmetic upgrades, coupled with advertisements. Mobile platforms now serve as a gateway to untapped markets for prominent PC and console game developers like Activision, EA Games, Riot Games, and Ubisoft. These industry giants strategically launch titles designed for mobile platforms, mirroring their console counterparts but with reduced computational demands.
Subway Surfers claimed the most popular game title in 2022, compiling 304 million downloads. Its dominance extended across both iOS and Google Play platforms. Another noteworthy mention is Stumble Guys, which is experiencing remarkable growth, with 200 million additional downloads in 2022 compared to 2021.
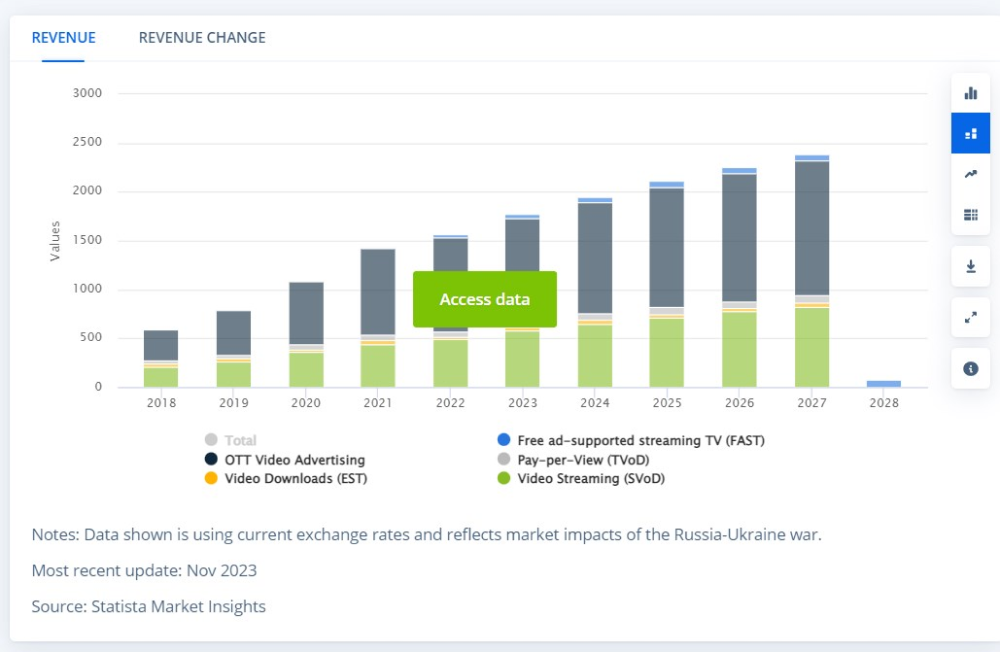
17. Online video streaming is dominated by prominent Over-the-top (OTT) Services like YouTube, Netflix, Amazon Prime Video, Disney+ Hotstar, and AppleTV+.According to Statista, the OTT market revenue surged from $121.61 billion in 2019 to an anticipated $275.30 billion by 2022, further escalating to a projected $476.60 billion by 2027, exhibiting a robust CAGR of 11.60% (2022-2027). The user penetration ratio is expected to rise from 35.7% in 2022 to a promising 44.1% by 2027, highlighting the escalating global engagement with these streaming platforms.
18. The live-streaming mobile app landscape is experiencing exponential growth. In 2022, the global market for live streaming reached $18.6 billion, with projections soaring to $33.4 billion by 2027. Bigo Live emerged as the leading earner in Q1 2022, amassing approximately 82 million US dollars in consumer spending. Surprisingly, Twitch, boasting the most extensive daily user base among the top 10 live-streaming apps, secured the second position, generating around 73 million US dollars. Tango clinched the third spot with earnings surpassing 30 million US dollars. This data underscores the substantial revenue potential of live-streaming apps, where earnings can outshine user base size.
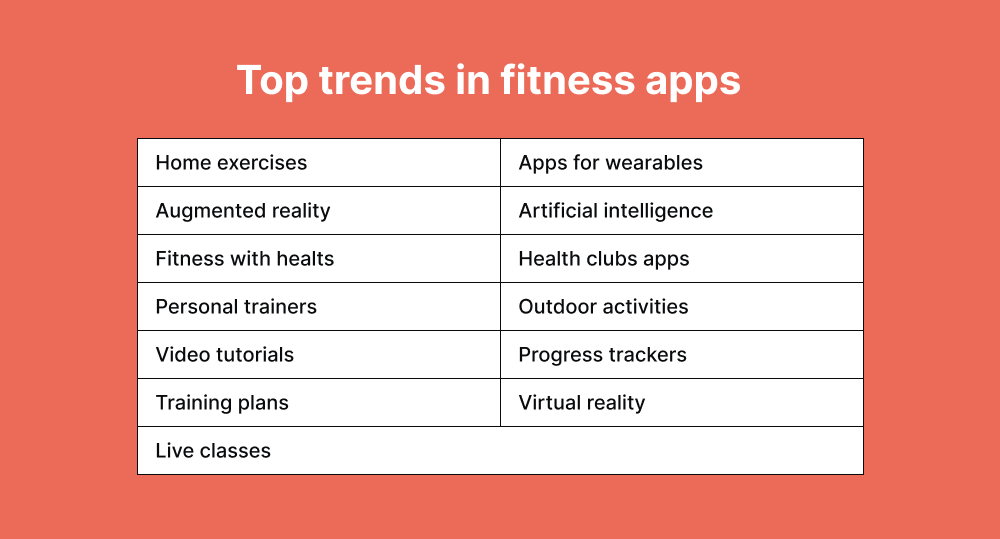
19. Over recent years, the adoption of fitness apps among Americans has steadily risen, fueled by factors like affordability, convenience, and user-centric features. Notable fitness apps include Fitbit, Strava, 7-Minute Workout, MyFitnessPal, and Nike Run Club.
20. A considerable 35% of American adults have incorporated medical mobile apps into their lives, leveraging functionalities like accessing medical records, scheduling appointments, and communicating with healthcare providers.
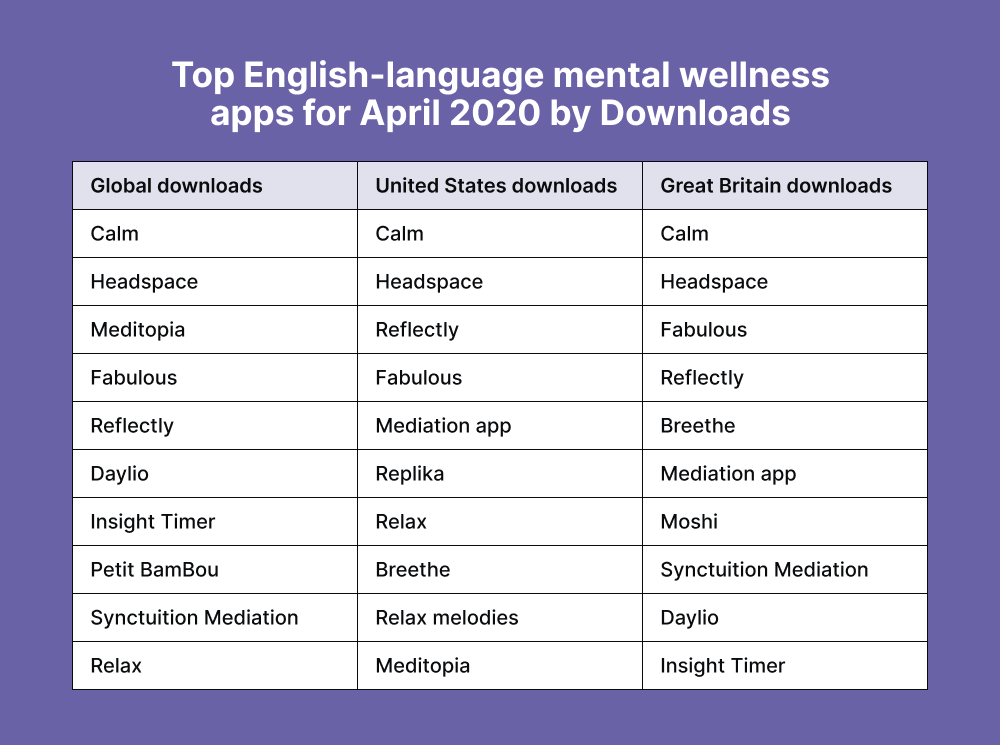
21. In a survey of 1,502 US adults, 32% reported using mental health applications, particularly younger adults, women, and those with mental health conditions. The growing trend indicates a positive impact on mental health enhancement.
22. Health-conscious individuals in the United States, accounting for 44%, use health-tracking applications to monitor parameters such as weight, blood pressure, blood sugar levels, heart rate, sleep, steps, food intake, and exercise.
23. 60% of US adults use cell phones, tablets, and computers/desktops to access health information. This trend has seen continuous growth as individuals increasingly use multiple devices for internet access.
Exploring mobile app development: Key facts and statistics
24. Revenue insights:
- The Application Development Software segment is poised to reach a noteworthy USD 149.70 billion in 2022.
- The sector anticipates robust annual growth, aiming for a market volume of USD 218.80 billion by 2027, with the United States leading the revenue charts at USD 74,830 million in 2022.
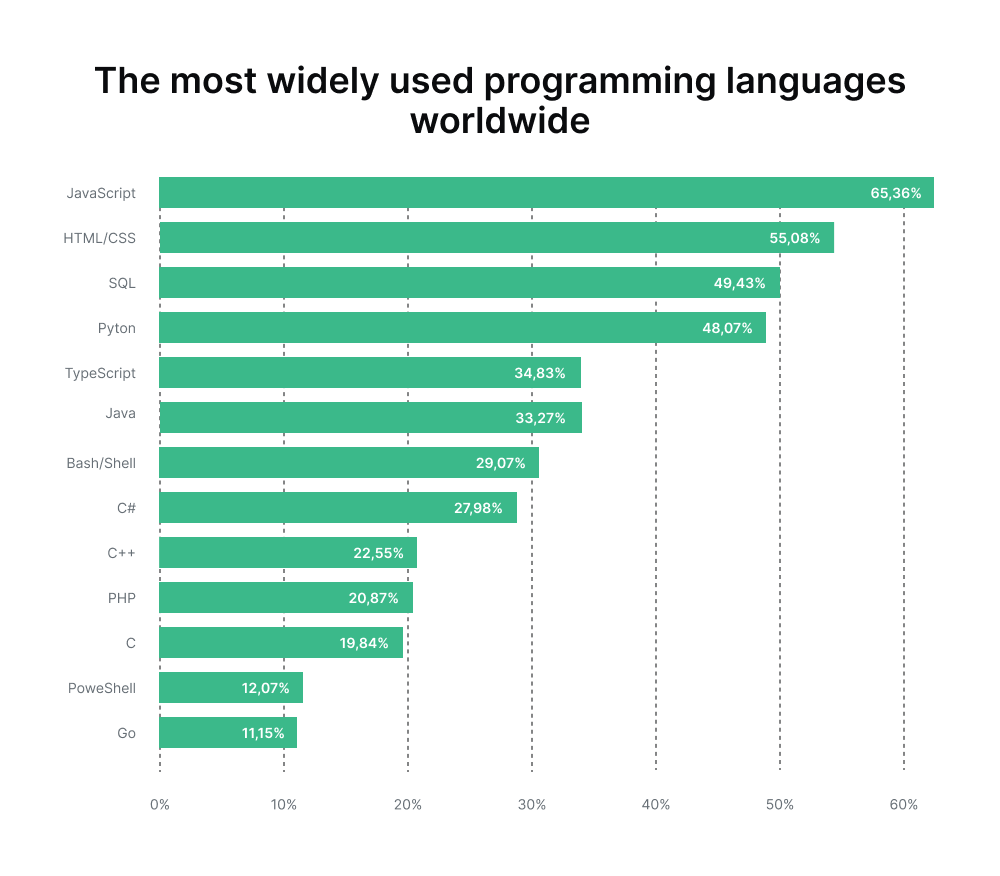
25. Programming language landscape (2022):
- JavaScript and HTML/CSS take center stage, with over 63% and approximately 55% adoption by global software developers.
- Other popular programming languages are Python, SQL, and TypeScript.
26. Cloud platform preferences (2021):
- AWS asserts dominance as the most sought-after cloud platform, capturing 40.35% interest from developers.
- Google Cloud Platform claims the second spot, attracting 22.56% of developers.
27. Apple App Store Payouts (As of Jan 2022):
- Apple demonstrates substantial support for developers, having paid over USD 260 billion to iOS app developers.
- This marks a notable increase from the previous cumulative payout of 200 billion US Dollars.
28. Global development markets:
- The USA and Asia-Pacific (APAC) countries emerged as the primary powerhouses in the world's mobile app development landscape, signifying substantial market influence.
Factors influencing mobile app growth
As discussed above, nearly one-third of users uninstall the app after the first use due to various factors. Let's explore them in detail:
Mobile app features and functionalities
Dynamic mobile UI/UX designs play a pivotal role in app success. Recent trends indicate:
- A compelling UI design boosts conversion rates by 200% and UX design by 400%.
- A remarkable ROI ratio of 9,900% is attributed to UX.
- Current UI/UX design trends include innovative in-app gestures, motion elements (preferred by 96% of users), augmented reality (expected to reach 1.73 billion users by 2024), and the integration of illustrations and characters for a rewarding user experience.
Optimal performance
Top-notch performance, marked by speed and stability, is imperative for app success.
- 30% expect their favorite app to load within seconds.
- 49% will wait for an app to load within 2-5 seconds.
- Failure to meet these loading speed expectations risks losing potential loyal users.
Platform-specific audience
Recognizing the regional user base distribution between Android and iOS platforms is crucial for strategic app development. The platform choice impacts development costs, with iOS development typically incurring higher rates. Consider:
- Android and iOS user base statistics to tailor your app development strategy.
The cost implications of Android and iOS app development.
The option of cross-platform or hybrid development for cost-effectiveness, providing revenue opportunities across multiple platforms. - Android and iOS user base statistics to tailor your app development strategy.
- The cost implications of Android and iOS app development.
- The option of cross-platform or hybrid development for cost-effectiveness, providing revenue opportunities across multiple platforms.
Emerging technologies in mobile app development
Let's explore the latest trends shaping mobile app development:
| Mobile App Development Trends | Description | Benefits | Considerations |
| 1. Artificial Intelligence (AI) | Game-changer, offers predictive, personalized, and intelligent apps. | Enhanced user experience, and efficiency in data processing. | Data privacy concerns, ethical considerations. |
| 2. Augmented Reality and Virtual Reality | Create immersive experiences, transforming industries like gaming, entertainment, education, and healthcare. | Improved engagement and realistic simulations. | Hardware requirements, potential for motion sickness. |
| 3. Mobile IoT Apps | Extend beyond B2C, benefiting B2B sectors like transportation and healthcare. | Enhanced connectivity and real-time data monitoring. | Security vulnerabilities, potential for data breaches. |
| 4. Mobile Payments | Convenience of online transactions and the widespread use of online wallets reshaping the retail landscape. | Faster transactions, seamless user experience. | Security concerns, reliance on internet connectivity. |
| 5. Cloud-Based Mobile Applications | Ensure seamless app functionality, scalability, and better user experiences. | Cost-effective, improved collaboration. | Data security, dependence on internet speed. |
| 6. 5G Connectivity | Revolutionized mobile app development with unparalleled speed, real-time data processing, and the ability to connect a million devices. | Faster data transfer, improved network reliability. | Infrastructure costs, limited global coverage. |
| 7. Greater Focus on UX/UI | Prioritize simple, intuitive interfaces for user satisfaction. | Increased user engagement, brand loyalty. | Design complexity, varied user preferences. |
| 8. Camera-Focused Apps | Simplify virtual interactions, with trends like Zoom and Google Meet expected to persist in 2024. | Enhanced communication, visual collaboration. | Privacy concerns, resource-intensive. |
| 9. Beacon Technology | Offers personalized experiences by sending targeted ads and notifications based on user location. | Improved user engagement, personalized marketing. | Privacy issues, potential for intrusive experiences. |
| 10. Focus on Superior App Security | Paramount for apps dealing with sensitive data. Two-factor authentication, biometric authentication, and encryption are essential. | Protection against data breaches, user trust. |
Implementation costs, user inconvenience. |
| 11. Low Code/No Code Platforms | Streamline app development, enabling faster creation without extensive coding knowledge. | Faster time to market, broader participation in development. |
Limited customization, potential for code quality concerns. |
| 12. Voice Search | Transforms how users interact with apps, providing hands-free commands. | Enhanced accessibility, improved user multitasking. | Speech recognition limitations, potential privacy concerns. |
| 13. Motion Design | Enhances user experience, offering visual cues and feedback for more enjoyable interaction. | Improved usability, aesthetic appeal. | Resource-intensive, potential for user distraction. |
| 14. Apps for Foldable Devices | Present a unique challenge, requiring apps to adapt to different screen types and sizes. | Enhanced user experience, innovative design opportunities. | Limited market adoption, development complexity. |
| 15. On-Demand Apps | Cover services like taxis, food delivery, and grocery shopping. Their convenience, extensive features, and ease of use align with evolving consumer preferences. | Time-saving, increased accessibility. | Competitive market, regulatory challenges. |
| 16. Wearable Technology | Smartwatches, fitness bands, and trackers redefine mobile app development, allowing exploration of new features and data analytics. | Health monitoring, seamless integration with daily activities. | Limited screen size, battery life challenges. |
| 17. Blockchain | Enters mobile app development, ensuring secure transactions and reducing reliance on intermediaries. Its application extends to decentralized apps, providing cost-effective and automated solutions. | Enhanced security, transparency in transactions. |
Integration complexity, public perception challenges. |
Conclusion
It can be challenging to stand out in a world with countless Play Store and App Store apps. Mobile app developers are challenged to create unique and authentic apps catering to businesses and users. The digital space is highly competitive, with companies striving to capture attention and provide better user experiences. If you want your mobile app to be downloaded – and used –it should be user-friendly, solve problems, offer entertainment, and simplify daily life. And we hope that these mobile app development statistics shed some light on which path you should pursue.
How can Global App Testing help you?
With our comprehensive testing solutions, we ensure your mobile app is:
- Compatible with all the devices and platforms.
- Free of bugs and high-quality.
- Ensure it doesn't drain the battery and doesn't jeopardize device functionality.
- It's free from code vulnerabilities or security issues.
Keep learning
What is rapid software testing and how can I implement it?
32 Software testing statistics suitable for your presentation in 2025
14 Software testing best practices to develop high-quality product